Index of /assets/6b1de3ca827ba09f3680da0d35ef2ad5/image/png/135x104
Name
Last modified
Size
Description
Parent Directory
-
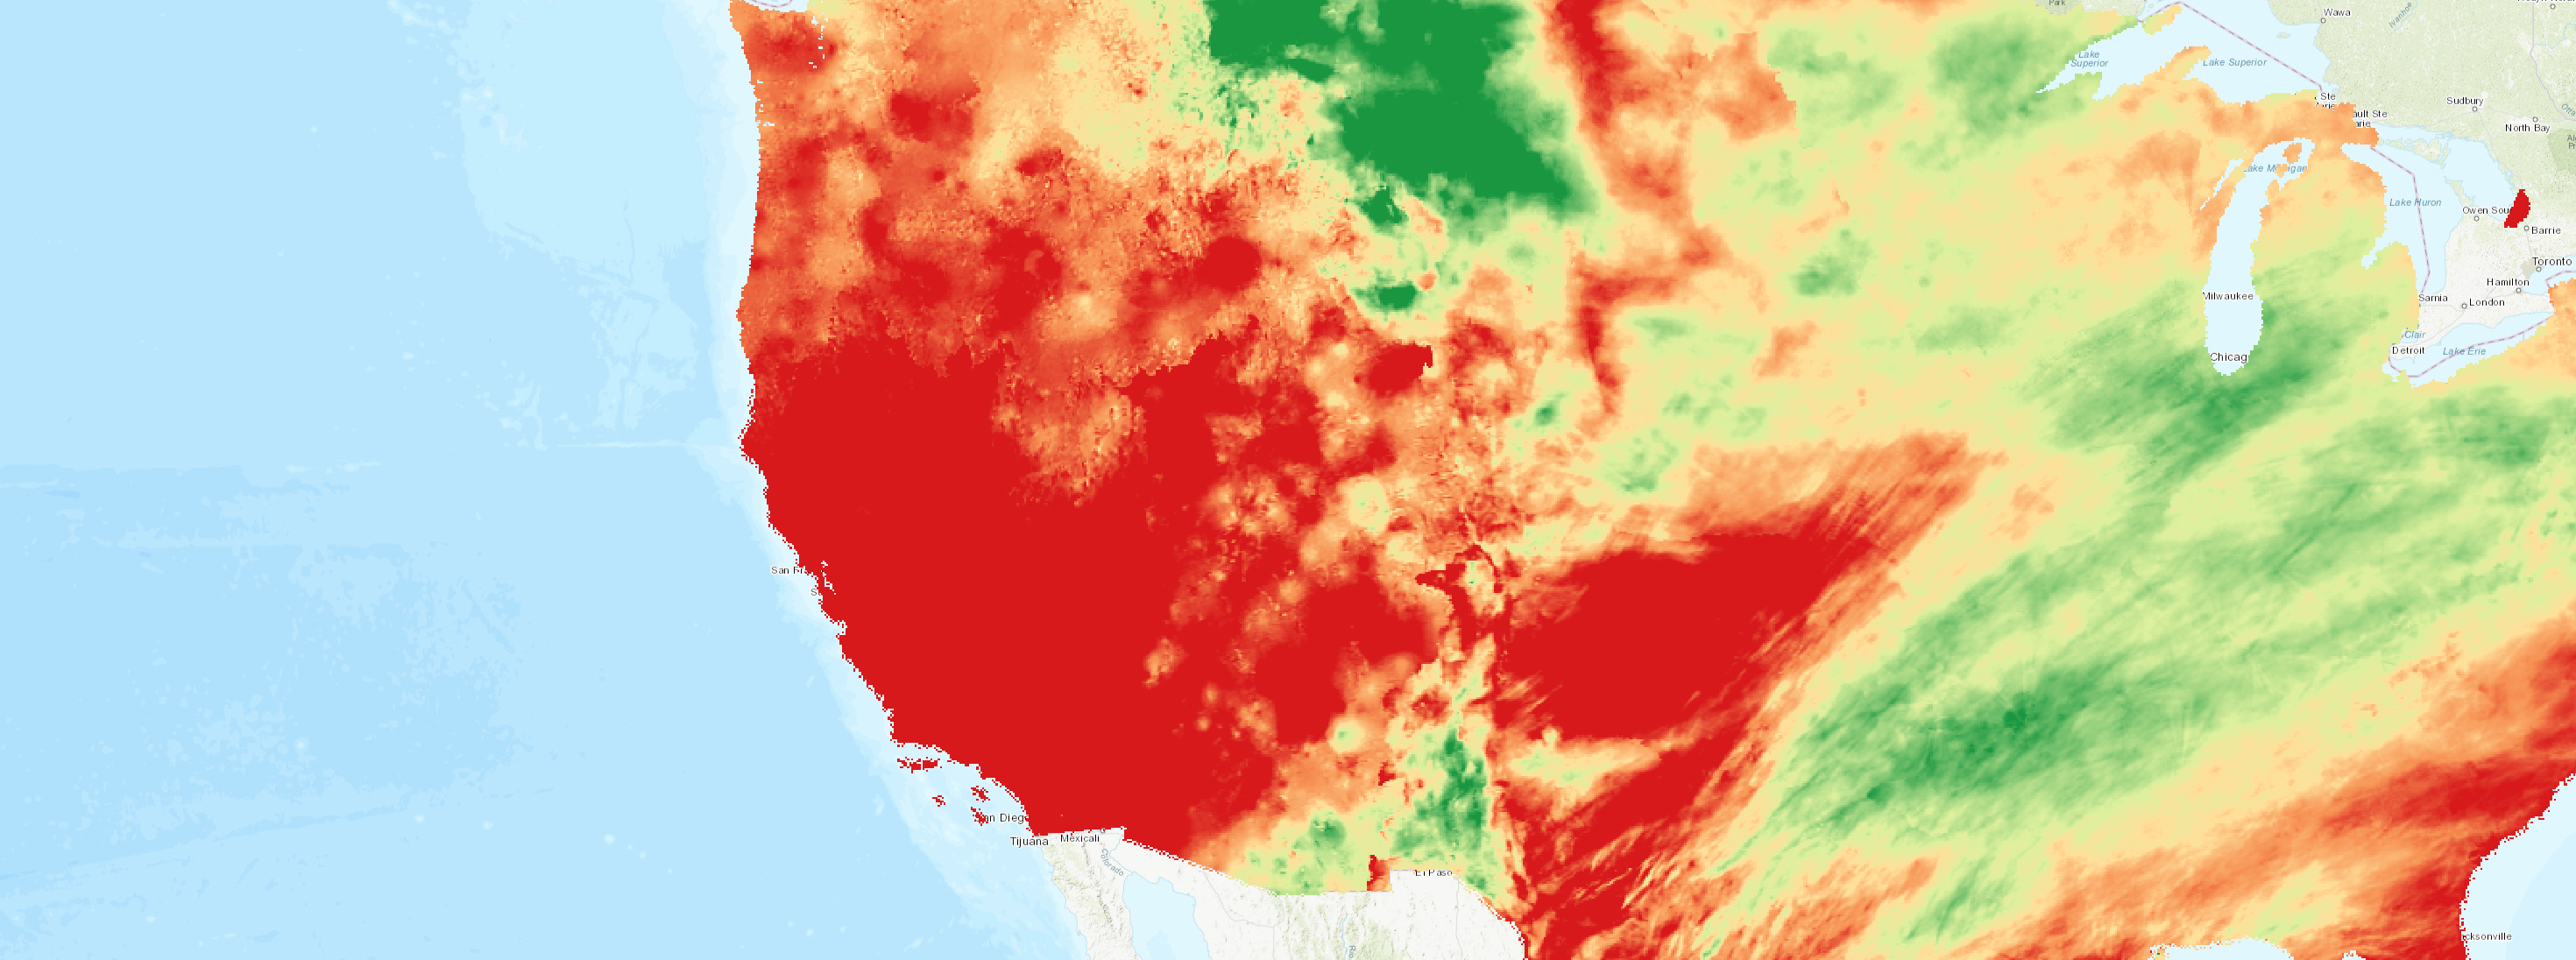
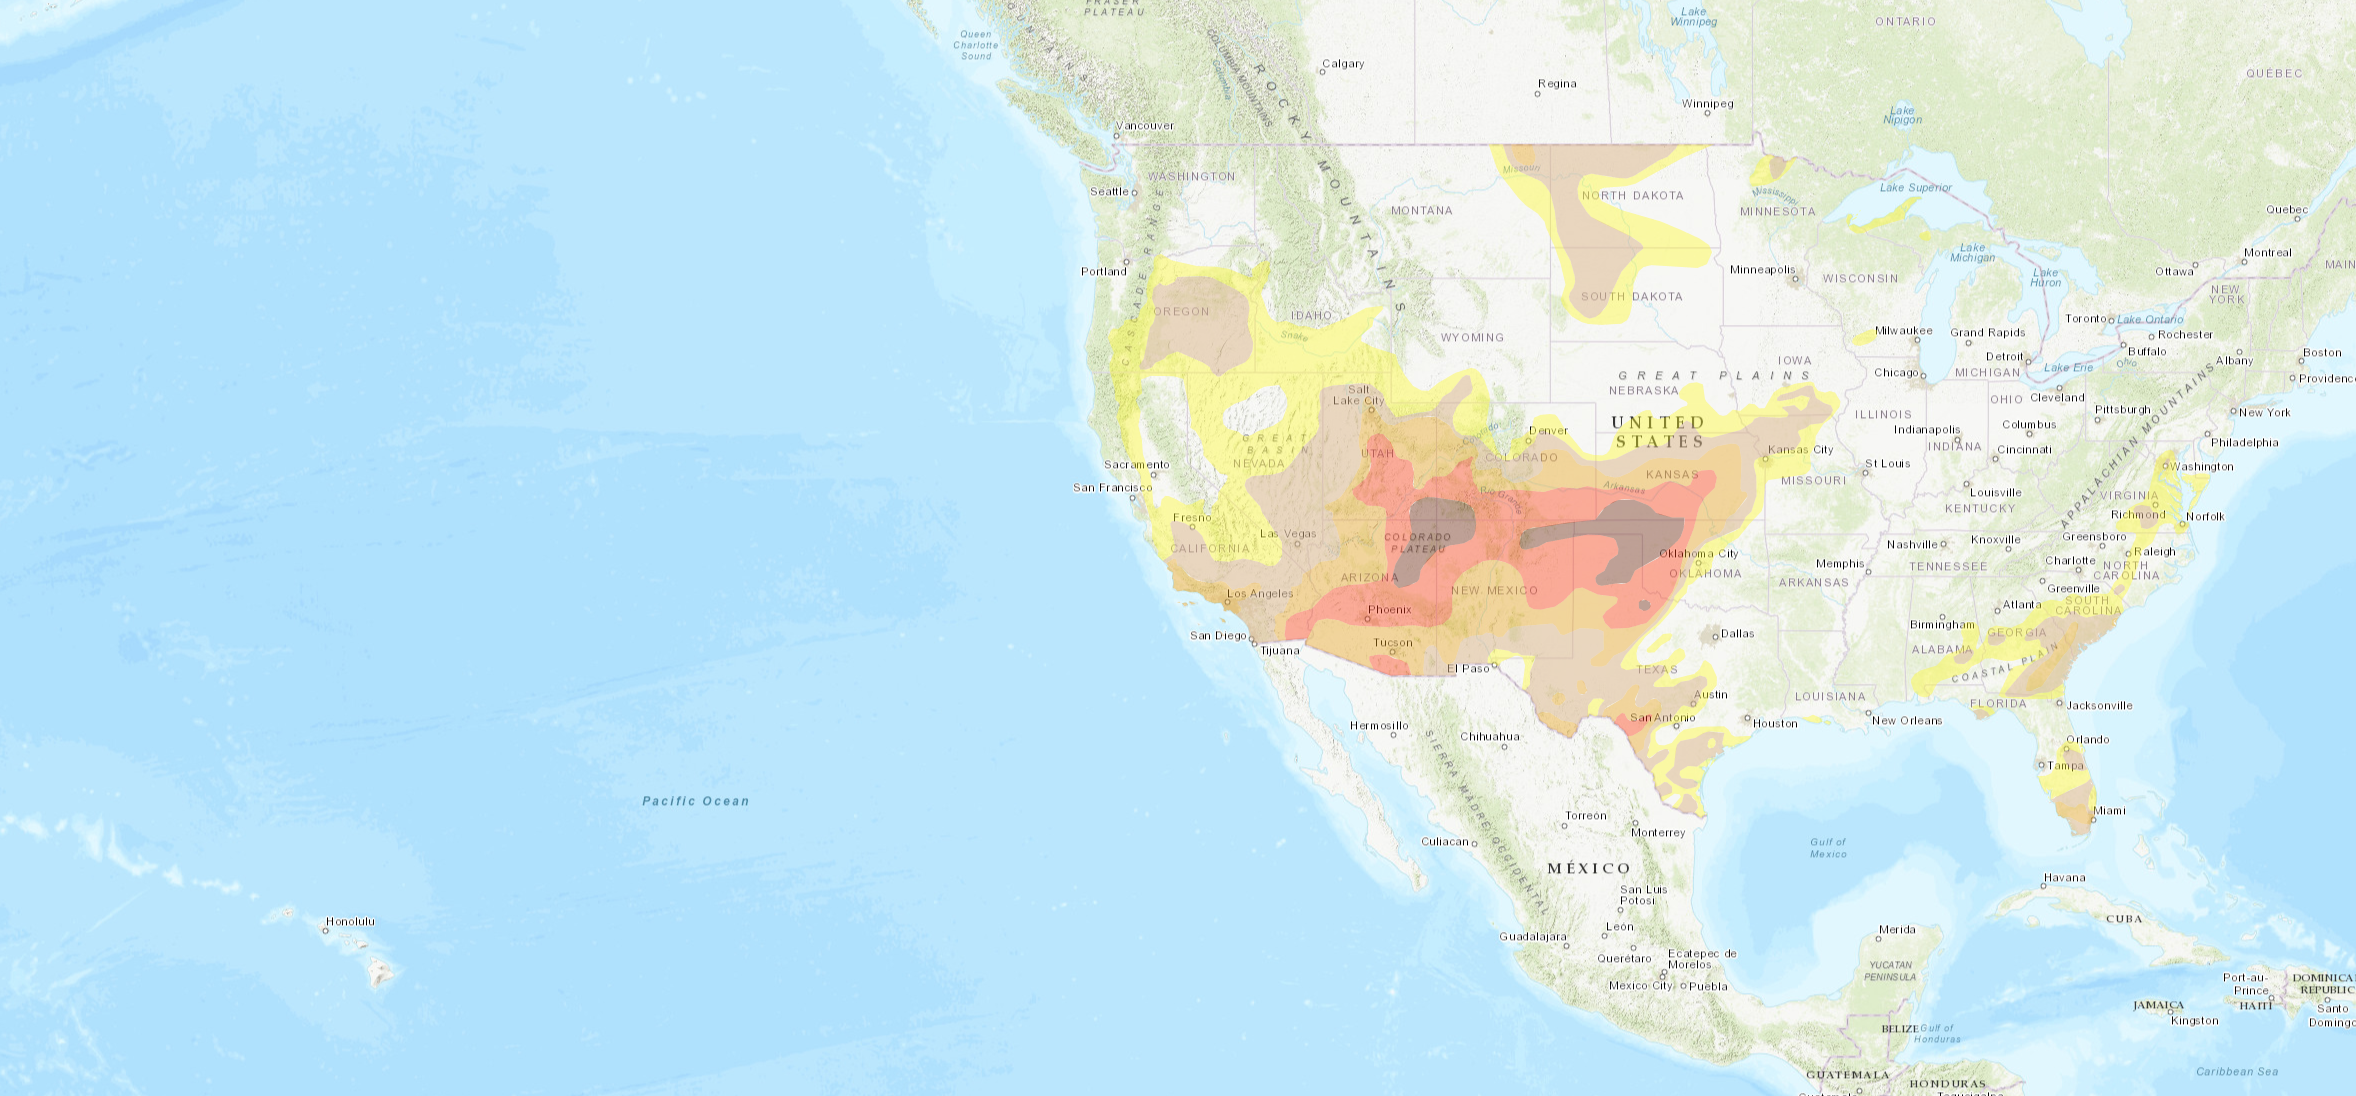
Areas_of_Drought_in_the_United_States.png
2020-03-10 17:25
27K
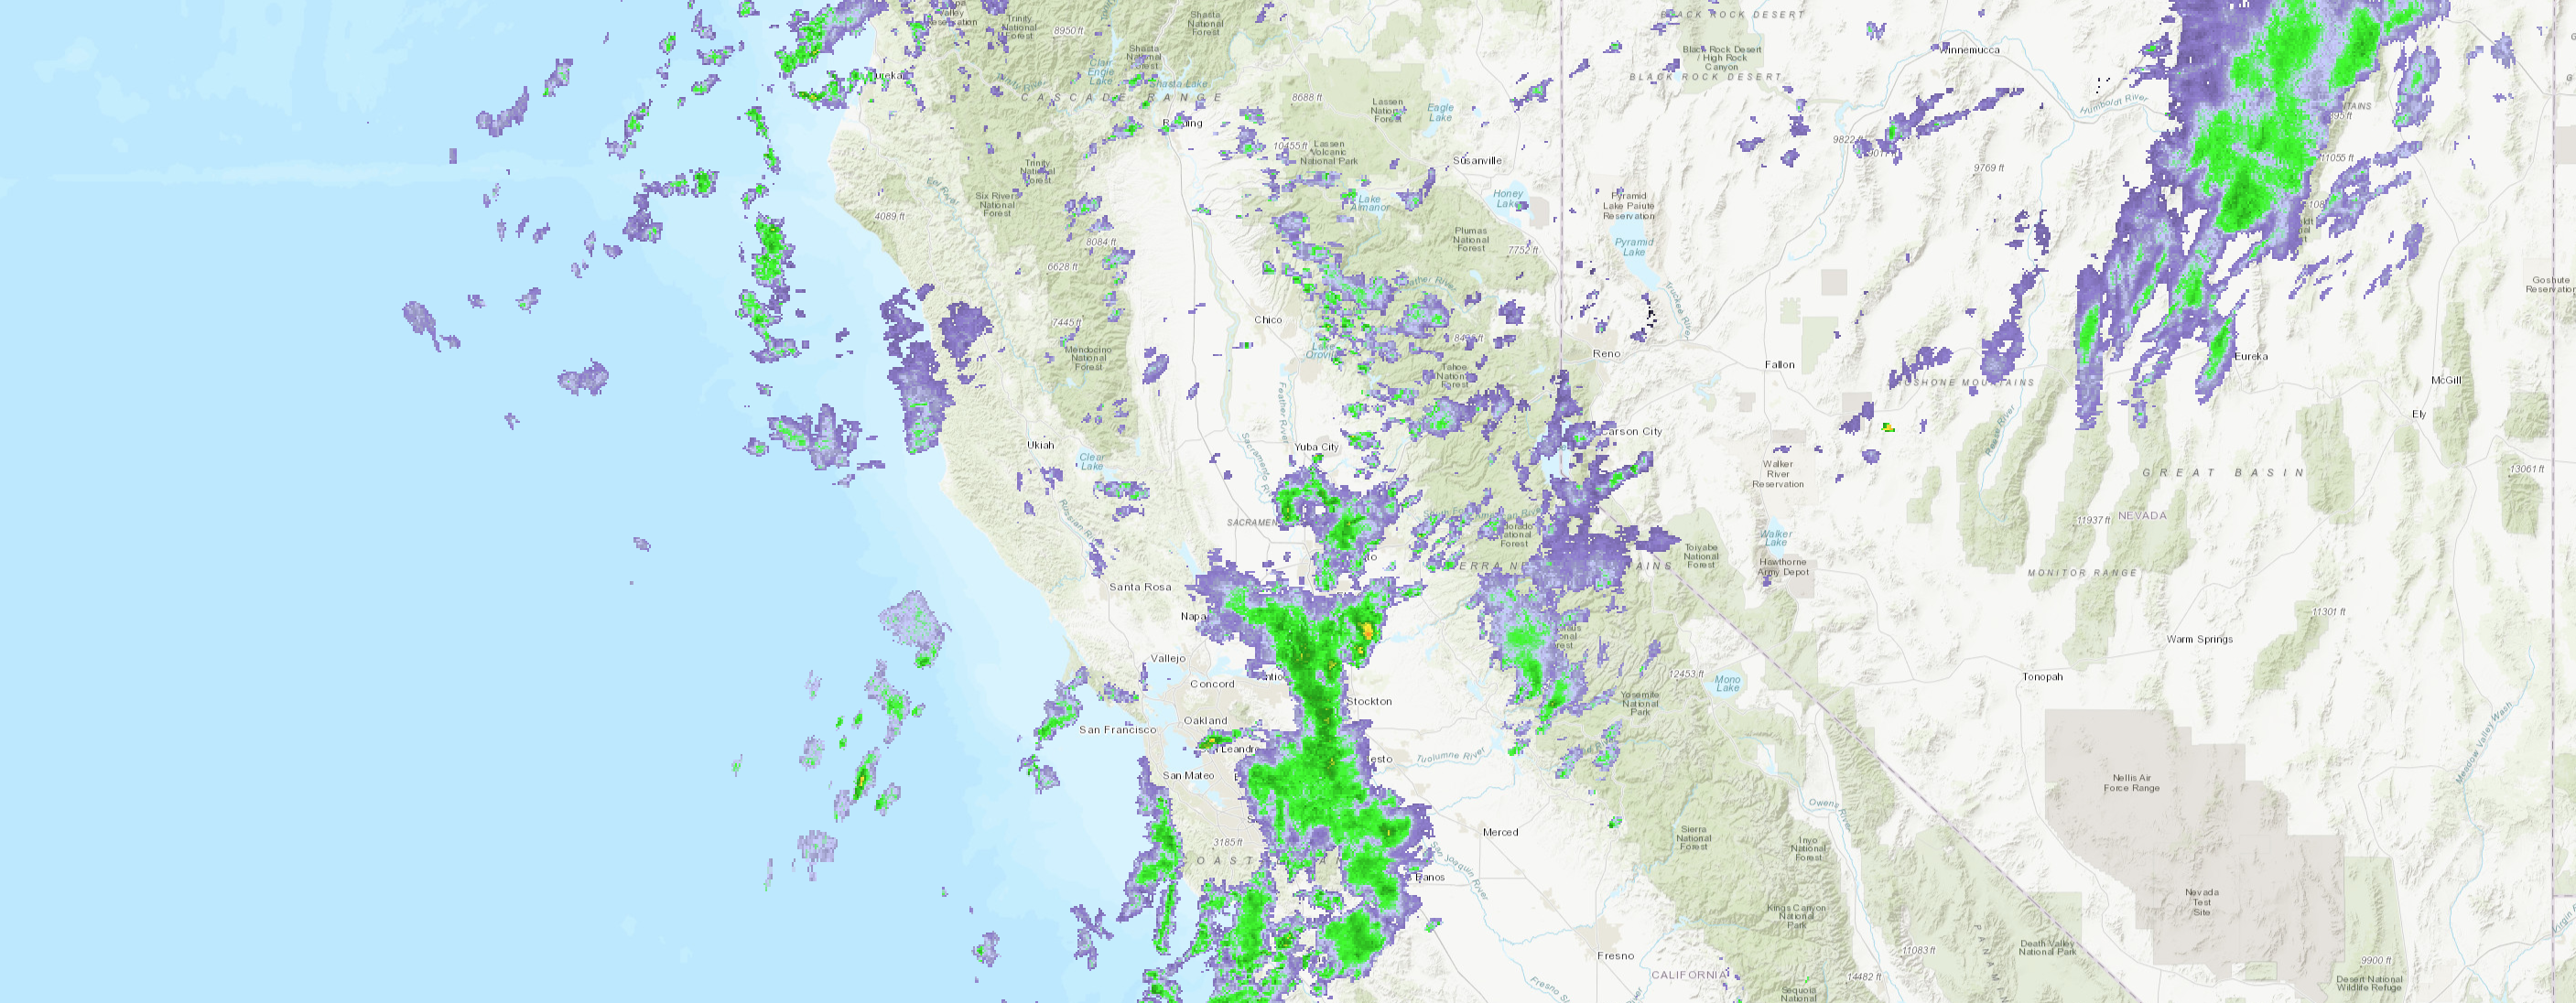
Base_Reflectivity_Radar_for_Central_California.png
2020-03-10 17:25
30K
Base_Reflectivity_Radar_for_Northern_California.png
2020-03-10 17:25
29K
Base_Reflectivity_Radar_for_Southern_California.png
2020-03-10 17:25
23K
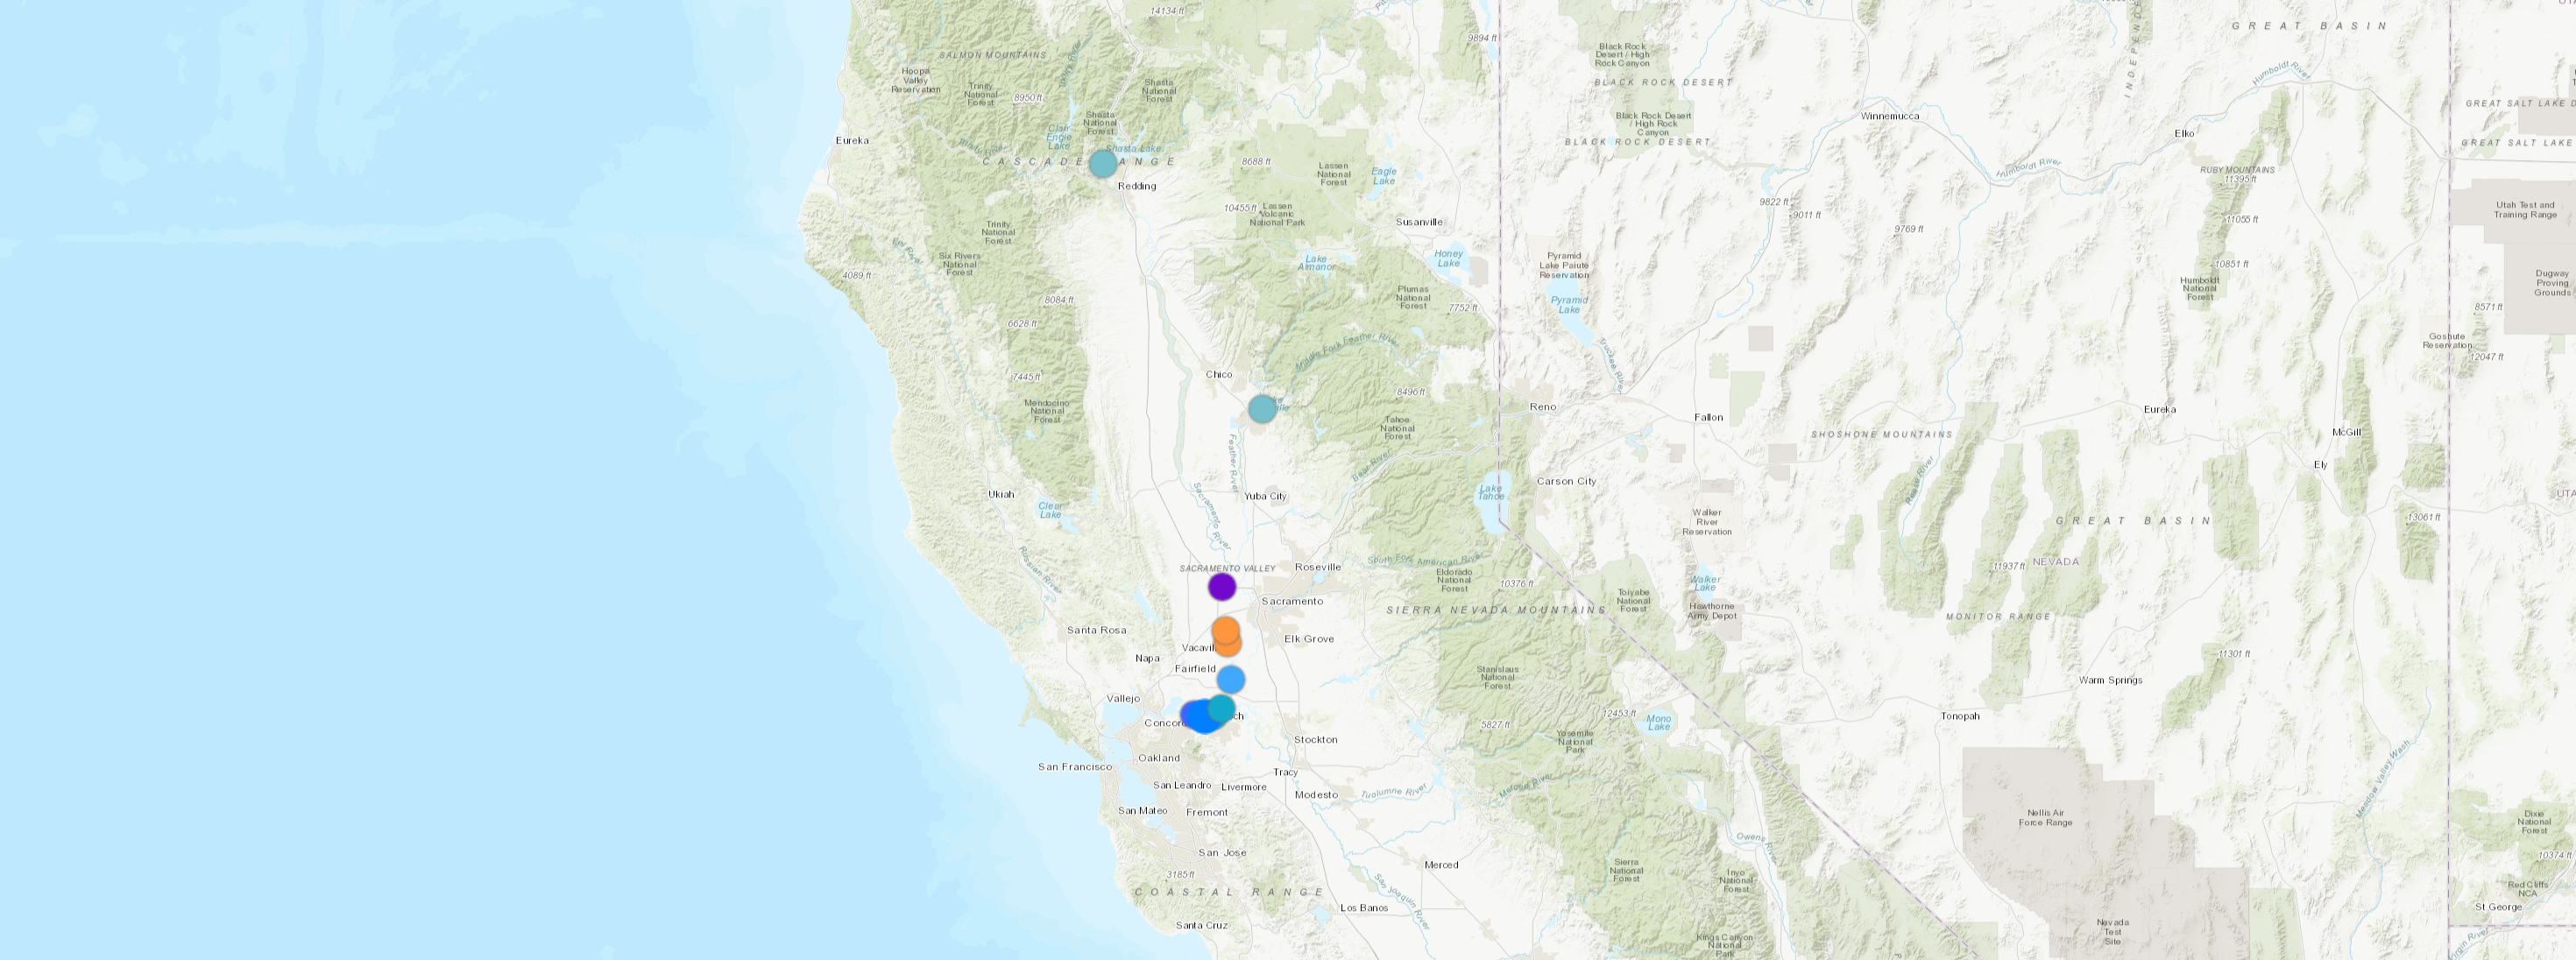
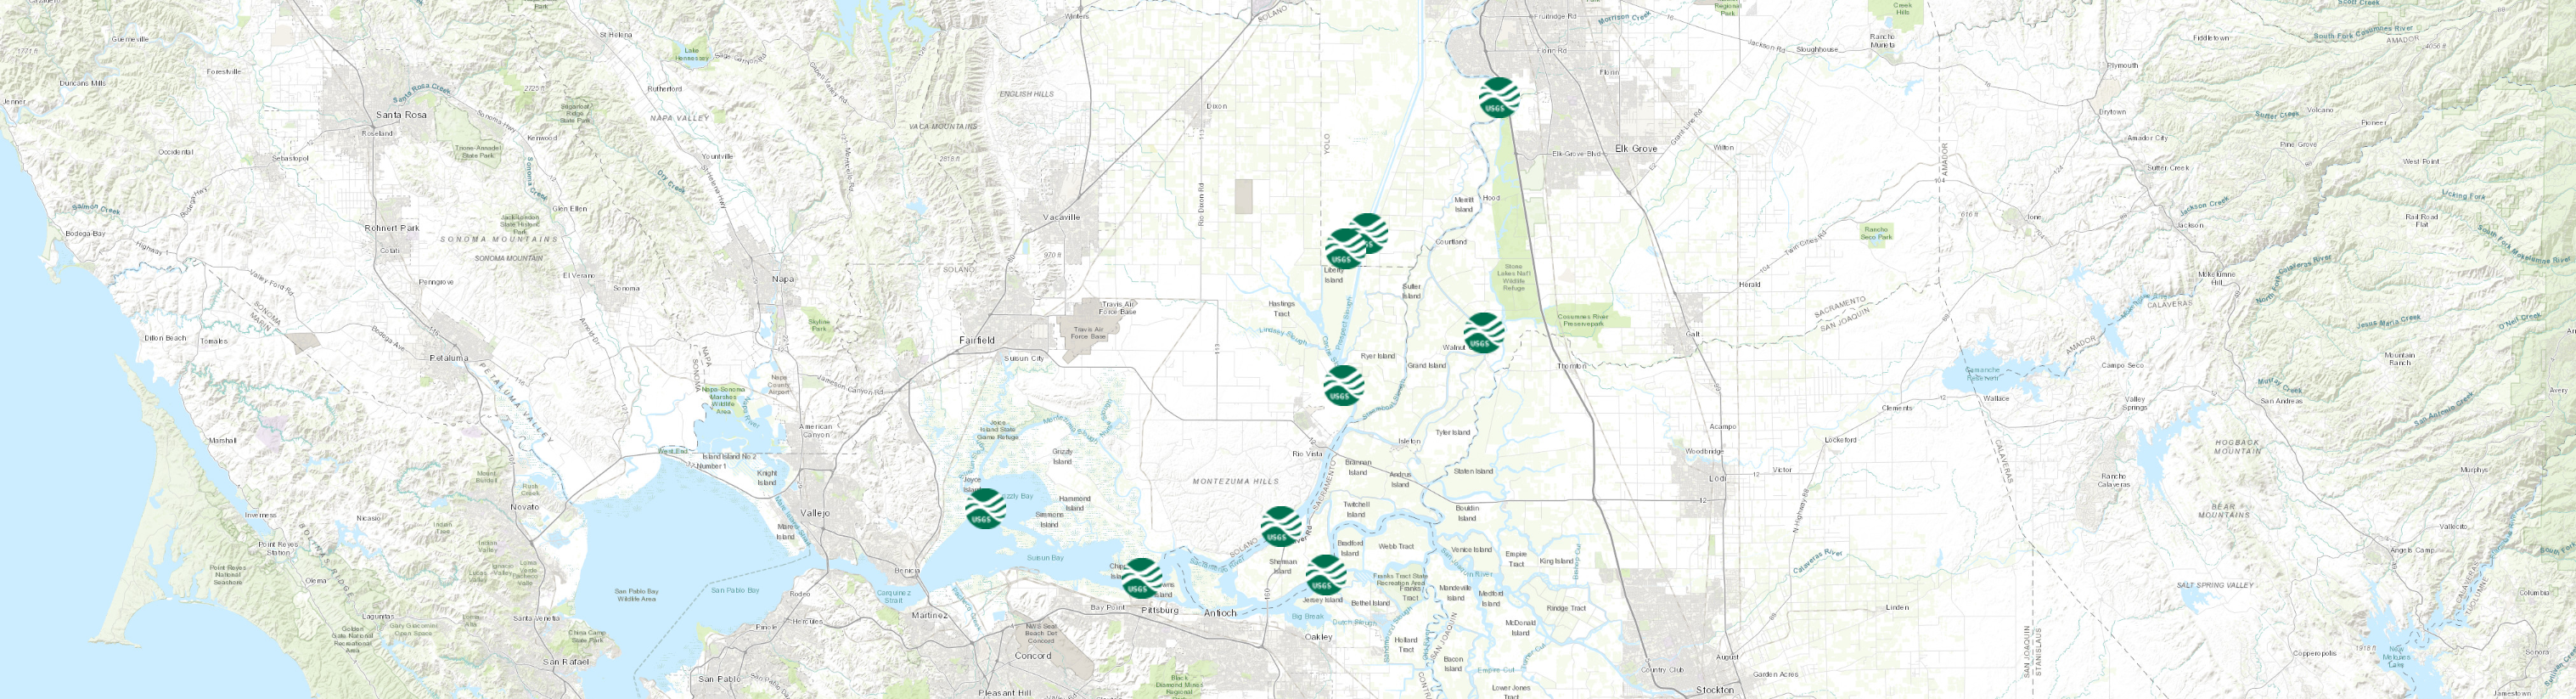
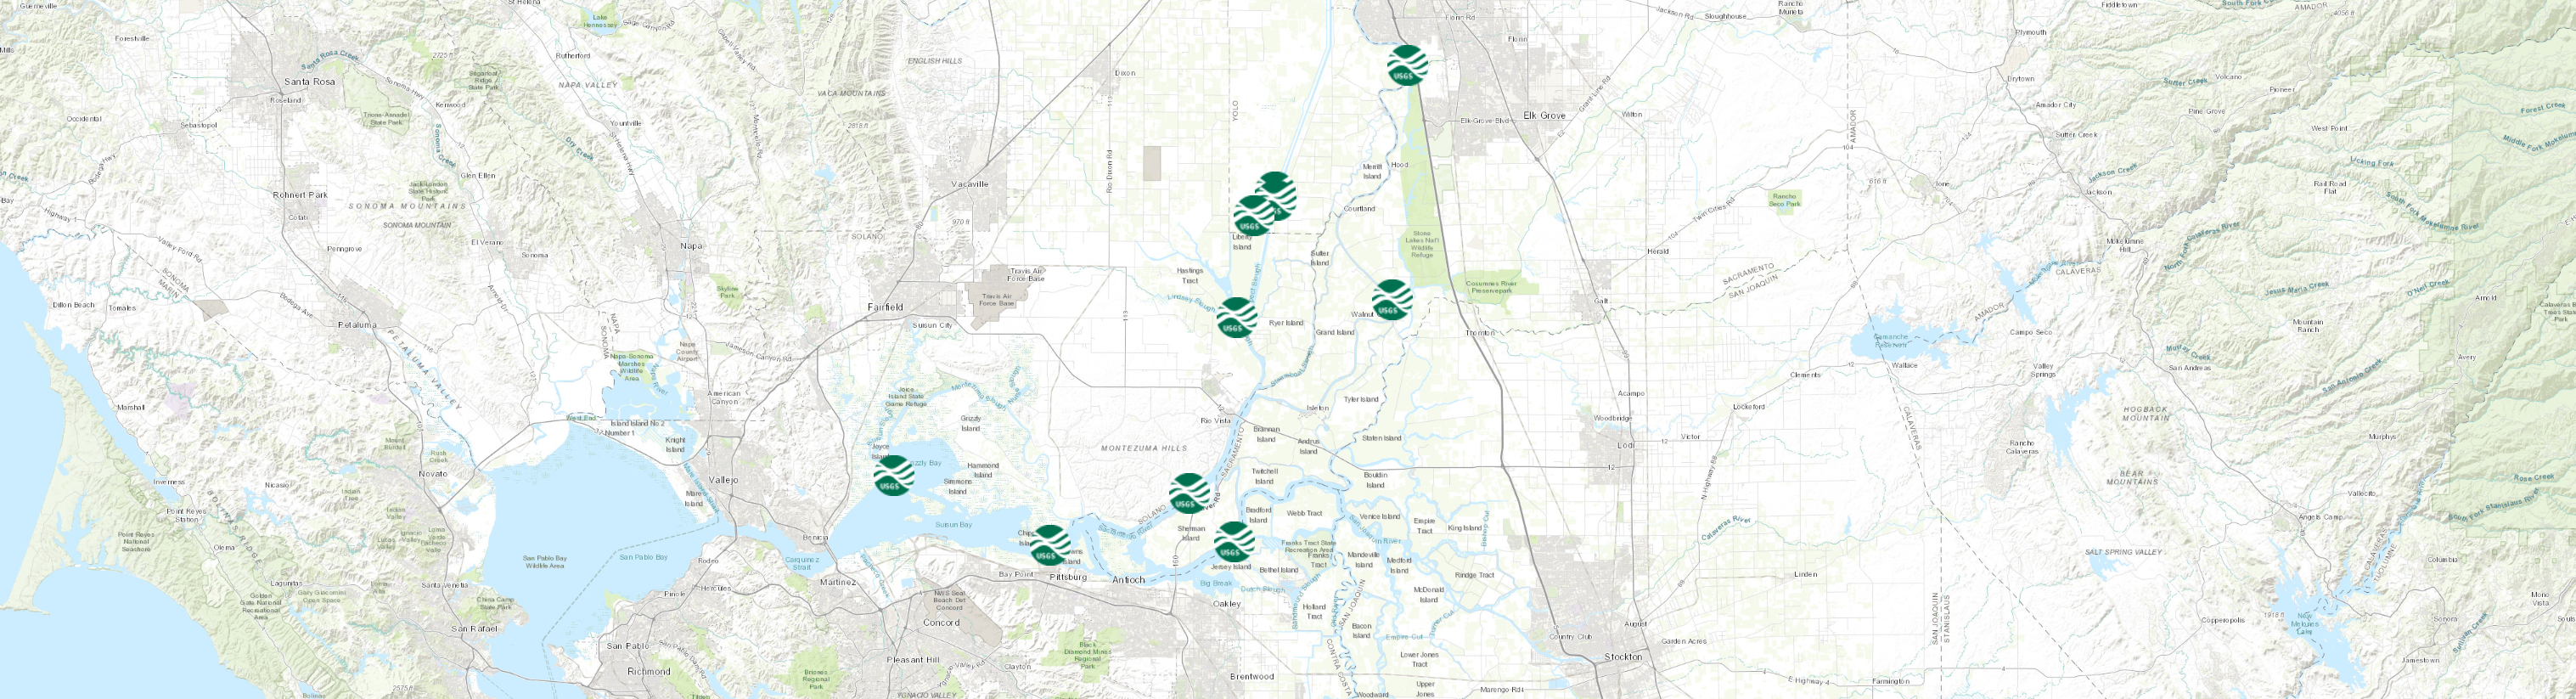
Bay-Delta_Ecosystem_Projects.png
2020-03-10 17:25
26K
CDOM_Fluorescence_(USGS)_3_Days.png
2020-03-10 17:25
27K
Central_California_Snow_Depth_(CDEC)__3_Days.png
2020-03-10 17:25
27K
Central_Snow_Water_Content_Revised_Last_14_Days.png
2020-03-10 17:25
29K
Chlorophyll_(CDEC)_Delta_Last_3_Days.png
2020-03-10 17:25
27K
Chlorophyll_Delta_Last_7_Days.png
2020-03-10 17:25
28K
DWR_Turbidity_(NTU)__Delta.png
2020-03-10 17:25
27K
Delta_River_Forecasts_(NOAA)_Next_7_Days_Chipps_Island_San_Joaquin_R._at_Venice_Island_Sacramento_R._at_Rio_Vista.png
2020-03-10 17:25
26K
Delta_Turbidity_FNU_(CDEC)_3_Days.png
2020-03-10 17:25
27K
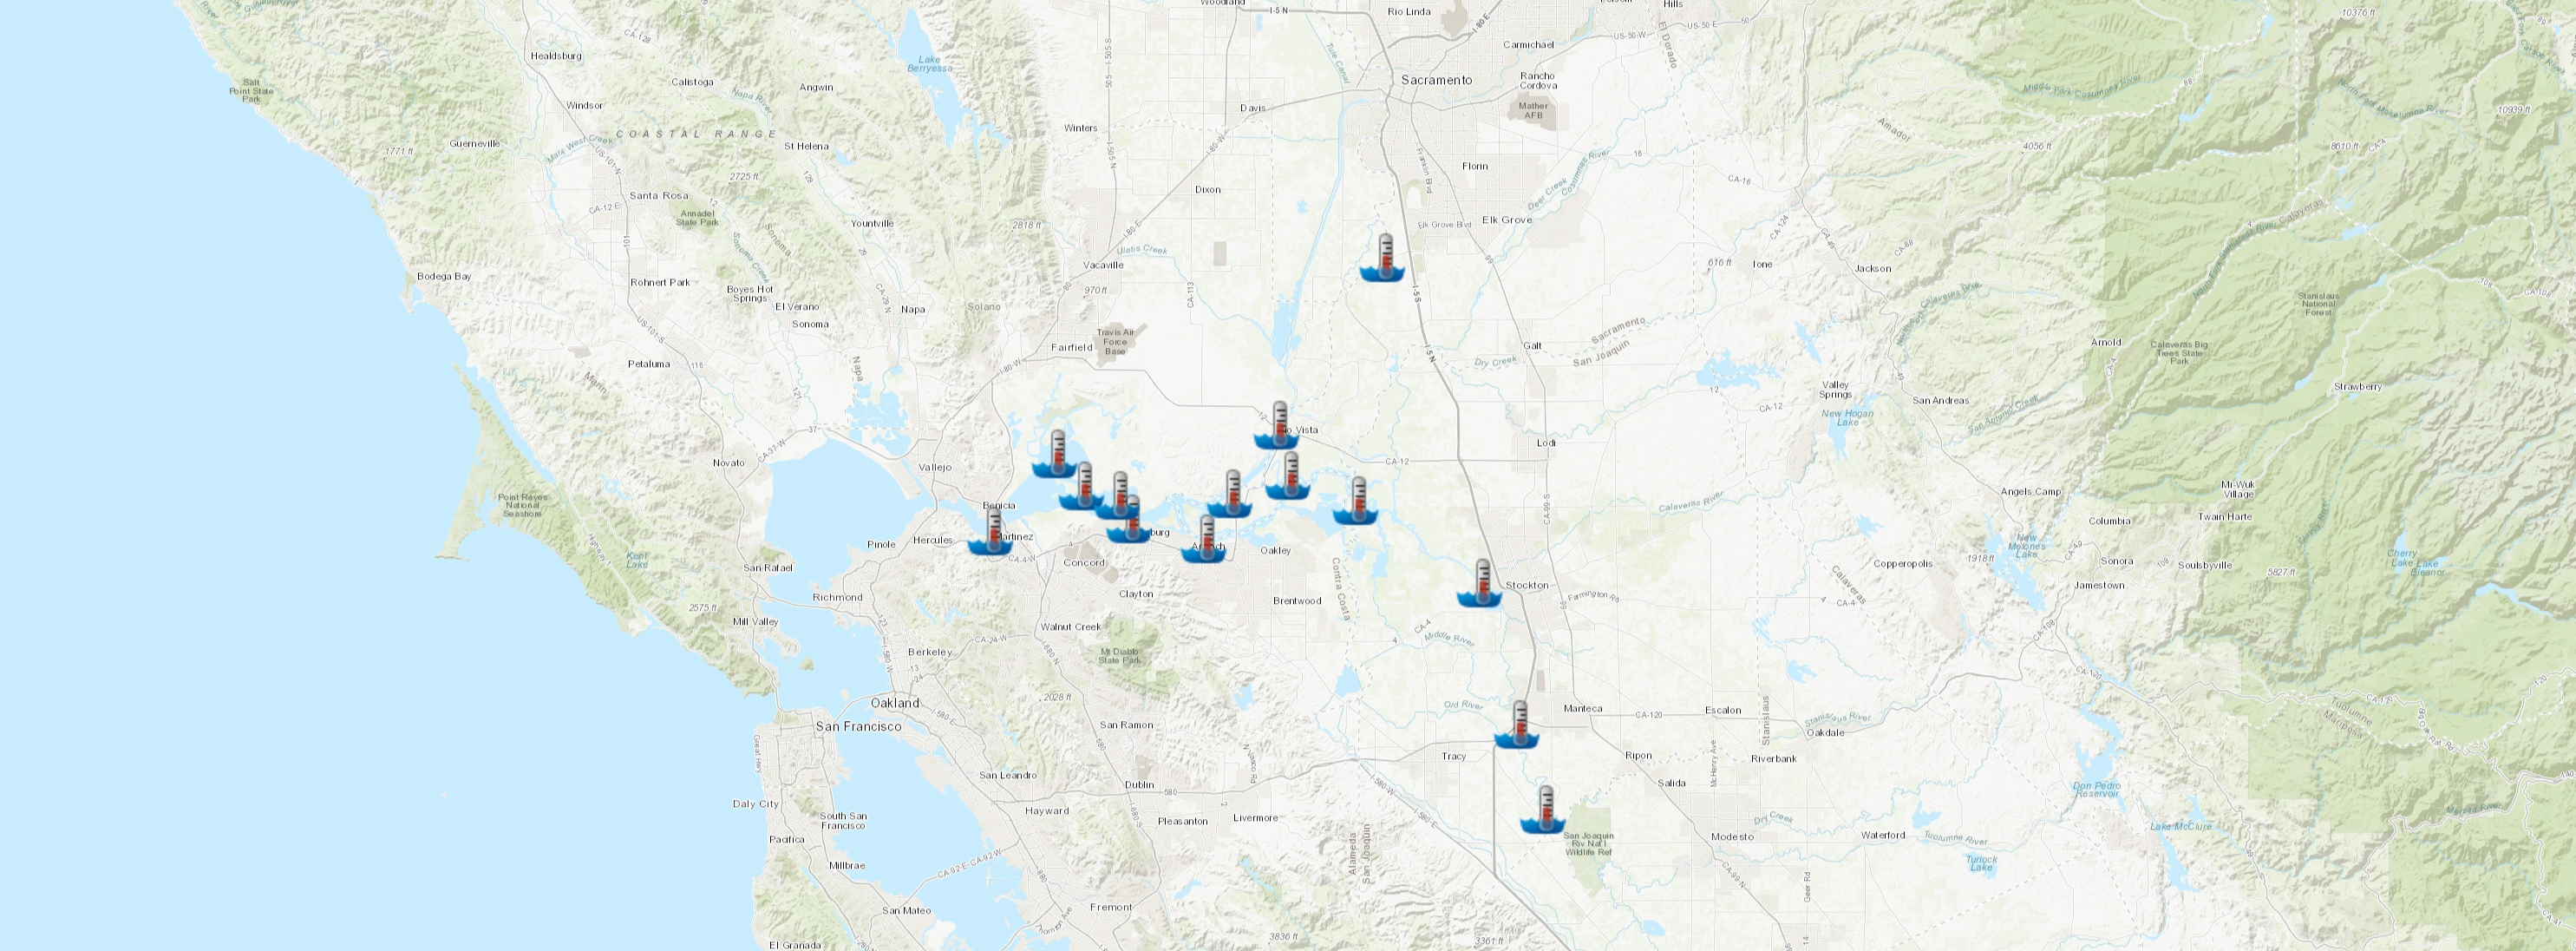
Delta_Water_Temperature_(CDEC)_3_Days.png
2020-03-10 17:25
26K
Dissolved_Bromide_Br_(USGS)_7_Days.png
2020-03-10 17:25
27K
Dissolved_Bromide_Br__Last_7_Days.png
2020-03-10 17:25
27K
Dissolved_Oxygen_%_Saturation_(USGS)_3_Days.png
2020-03-10 17:25
29K
Dissolved_Oxygen_(USGS)_3_Days.png
2020-03-10 17:25
27K
Dissolved_Oxygen_(USGS)_3_Days_BGC_Project.png
2020-03-10 17:25
29K
Dissolved_Oxygen_(USGS)_Delta_3_Days.png
2020-03-10 17:25
28K
Dissolved_Oxygen_Delta_Last_7_Days.png
2020-03-10 17:25
28K
Electrical_Conductivity_(Bottom_micro_s)__Delta.png
2020-03-10 17:25
28K
Electrical_Conductivity_(micro_s)_Select_Delta_Stations.png
2020-03-10 17:25
27K
Electrical_Conductivity_(micro_s)__Delta.png
2020-03-10 17:25
27K
Electrical_Conductivity_in_the_Delta.png
2020-03-10 17:25
27K
Flow_RIver_Discharge_(USGS)__3_Days.png
2020-03-10 17:25
26K
Flow_RIver_Discharge_(USGS)__7_Days.png
2020-03-10 17:25
27K
Flow_River_Discharge_-_Central_Delta.png
2020-03-10 17:25
27K
Flow_River_Discharge_in_the_Delta.png
2020-03-10 17:25
26K
IMG_2294.PNG
2020-03-10 17:25
7.2K
IMG_2295.PNG
2020-03-10 17:25
6.7K
IMG_2296.PNG
2020-03-10 17:25
7.5K
IMG_2297.PNG
2020-03-10 17:25
7.4K
IMG_2298.PNG
2020-03-10 17:25
7.6K
IMG_2299.PNG
2020-03-10 17:25
7.6K
IMG_2300.PNG
2020-03-10 17:25
7.6K
IMG_2301.PNG
2020-03-10 17:25
8.7K
IMG_2302.PNG
2020-03-10 17:25
7.6K
IMG_2303.PNG
2020-03-10 17:25
11K
IMG_2304.PNG
2020-03-10 17:25
17K
IMG_2305.PNG
2020-03-10 17:25
25K
IMG_2306.PNG
2020-03-10 17:25
7.1K
IMG_2307.PNG
2020-03-10 17:25
27K
IMG_2308.PNG
2020-03-10 17:25
7.2K
IMG_2309.PNG
2020-03-10 17:25
24K
IMG_2310.PNG
2020-03-10 17:25
10K
IMG_2311.PNG
2020-03-10 17:25
10K
IMG_2312.PNG
2020-03-10 17:25
18K
IMG_2313.PNG
2020-03-10 17:25
16K
IMG_2314.PNG
2020-03-10 17:25
5.7K
IMG_2315.PNG
2020-03-10 17:25
13K
IMG_2316.PNG
2020-03-10 17:25
11K
IMG_2317.PNG
2020-03-10 17:25
16K
IMG_2318.PNG
2020-03-10 17:25
13K
IMG_2319.PNG
2020-03-10 17:25
6.3K
IMG_2352.PNG
2020-03-10 17:25
22K
IMG_2356.PNG
2020-03-10 17:25
9.3K
IMG_2357.PNG
2020-03-10 17:25
6.7K
IMG_2358.PNG
2020-03-10 17:25
6.2K
IMG_2359.PNG
2020-03-10 17:25
11K
NO3plusNO2_Water_institu_(USGS)_3_Days.png
2020-03-10 17:25
27K
NO3plusNO2_water_Institu_(USGS)_3_Days.png
2020-03-10 17:25
27K
NOAA_(Tide_Predictions)__Next_7_Days.png
2020-03-10 17:25
29K
NOAA_National_Operational_Hydrologic_Remote_Sensing_Center_Data_Snow_Water_Equivalent.png
2020-03-10 17:25
23K
NOAA_National_Operational_Hydrology_Remote_Sensing_Center_Data.png
2020-03-10 17:25
24K
NRCS_SNOTEL_Snow_Water_Content_(R)_Stations_-_WY_to_Date.png
2020-03-10 17:25
29K
NWS_Percent_of_Normal_Precipitation.png
2020-03-10 17:25
28K
NWS_test.png
2020-03-10 17:25
30K
Northern_California_Snow_Depth_(CDEC)__3_Days.png
2020-03-10 17:25
26K
Northern_California_Snow_Water_Content_Revised_Season_to_date.png
2020-03-10 17:25
26K
Northern_Sierra_Precipitation_Index_(Incremental).png
2020-03-10 17:25
31K
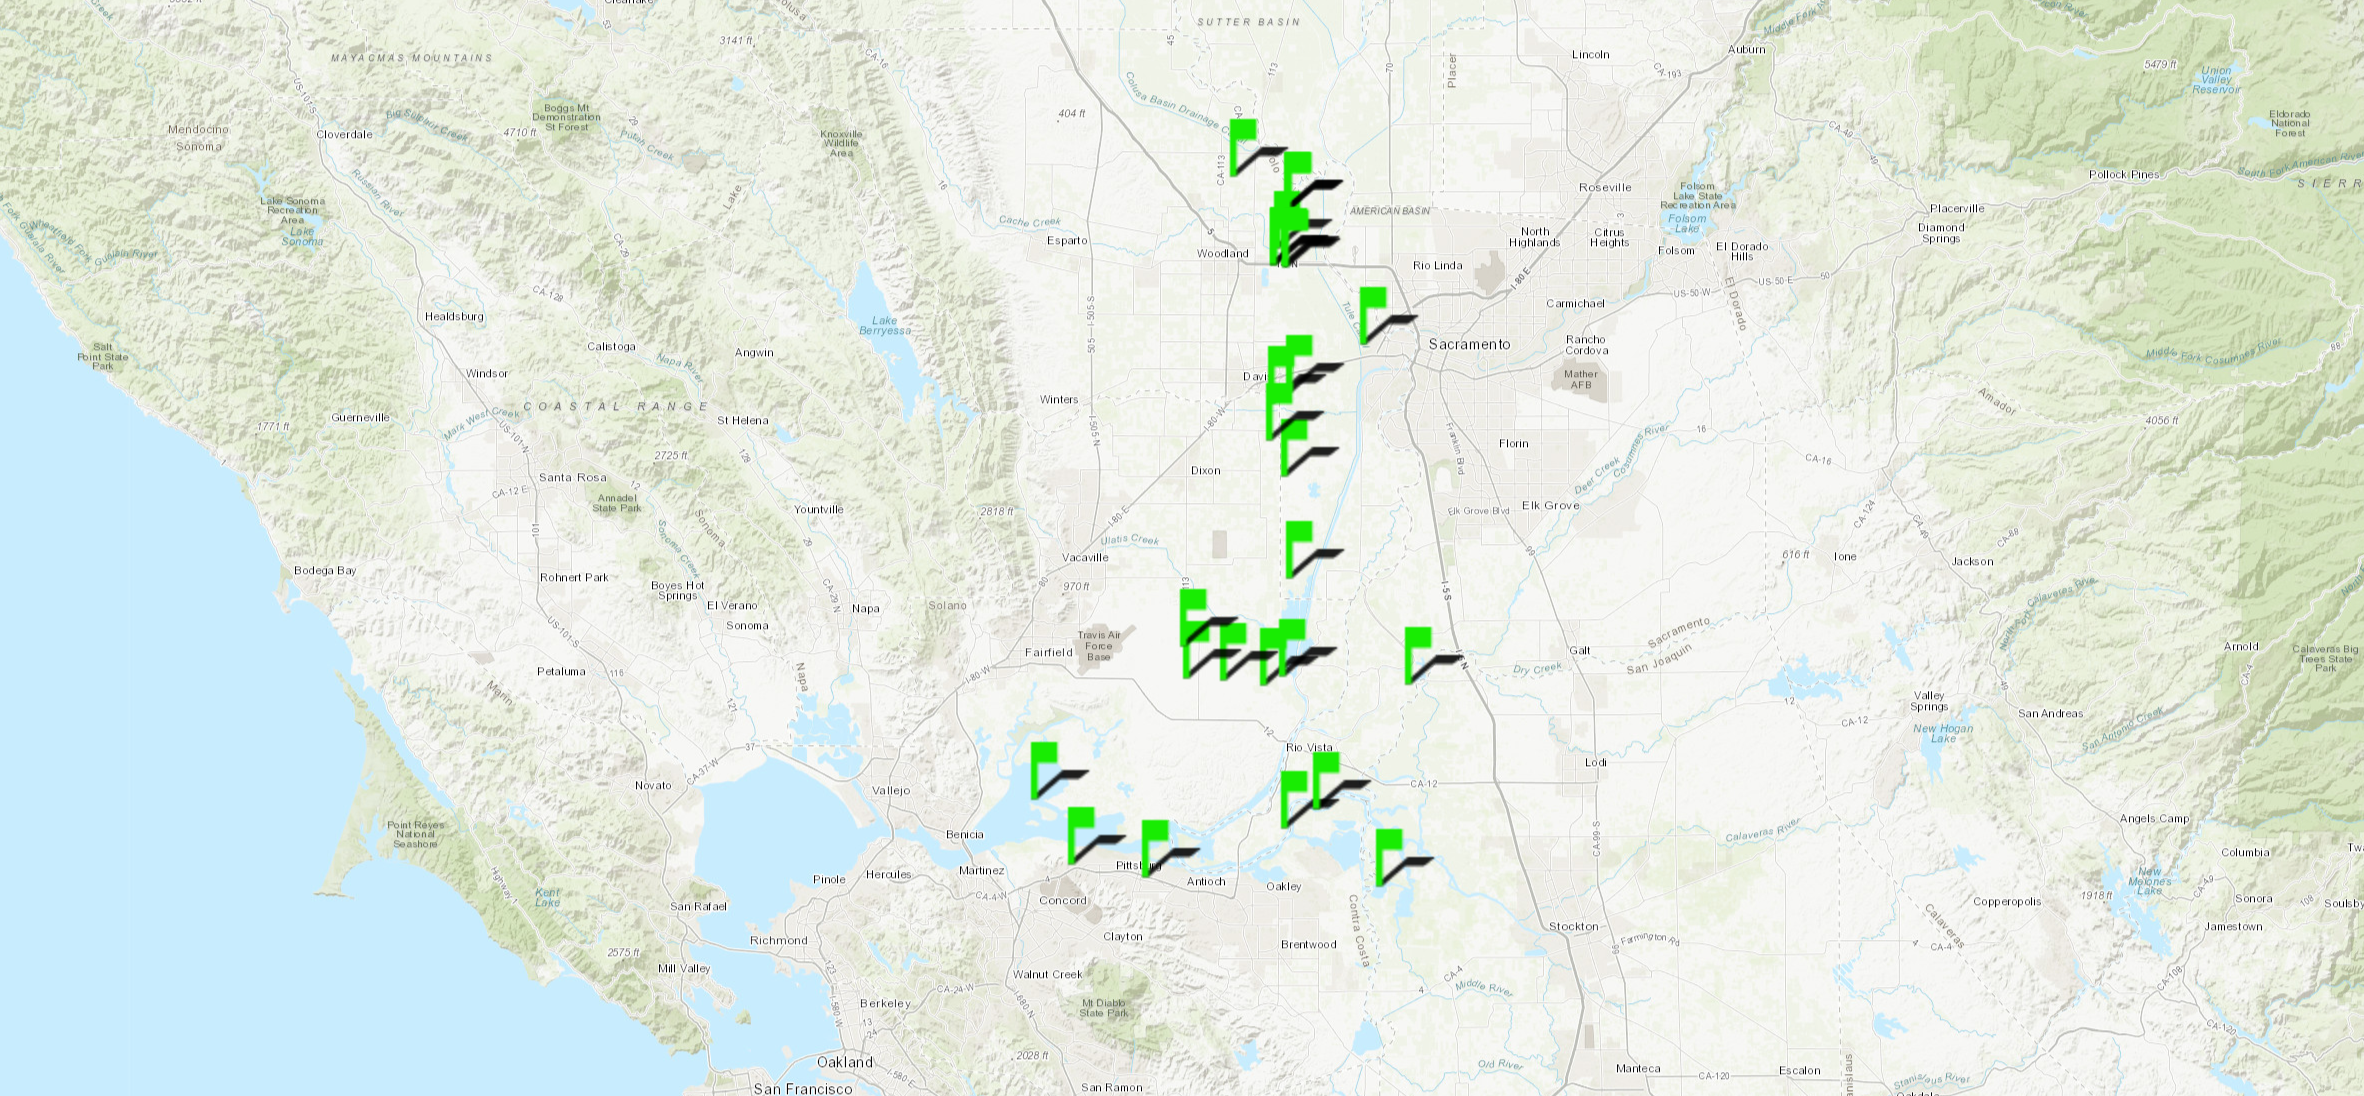
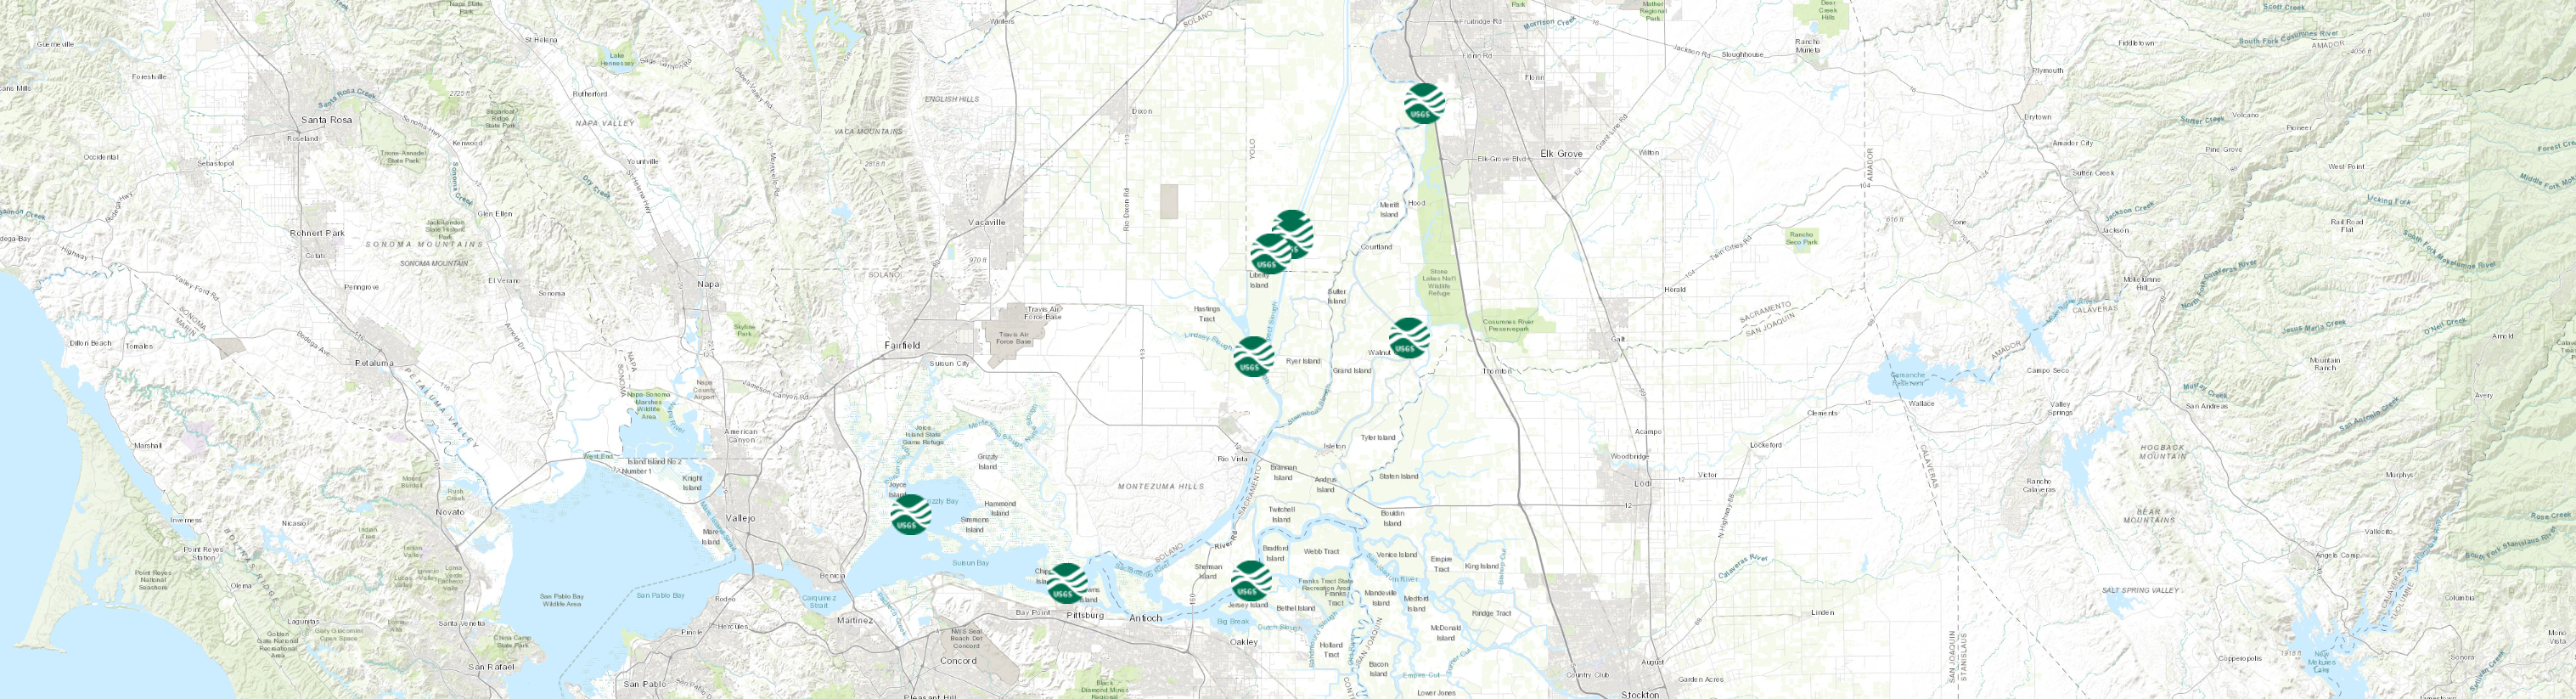
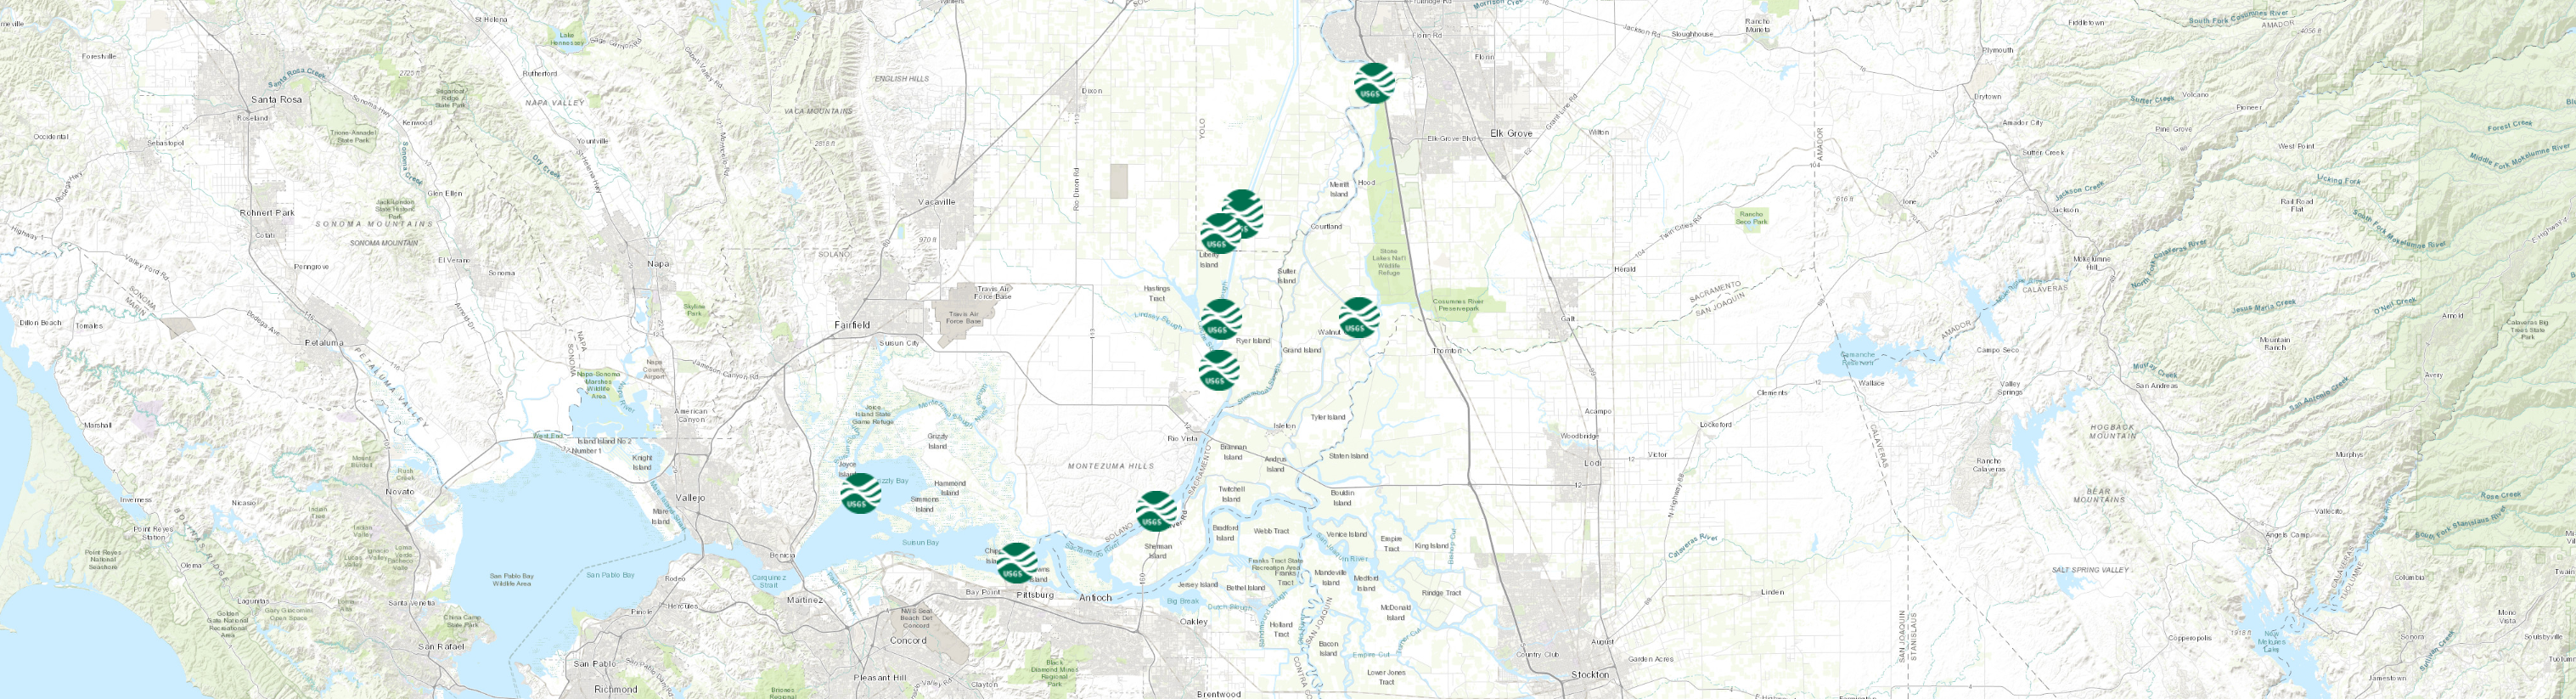
Project_Map.png
2020-03-10 17:25
28K
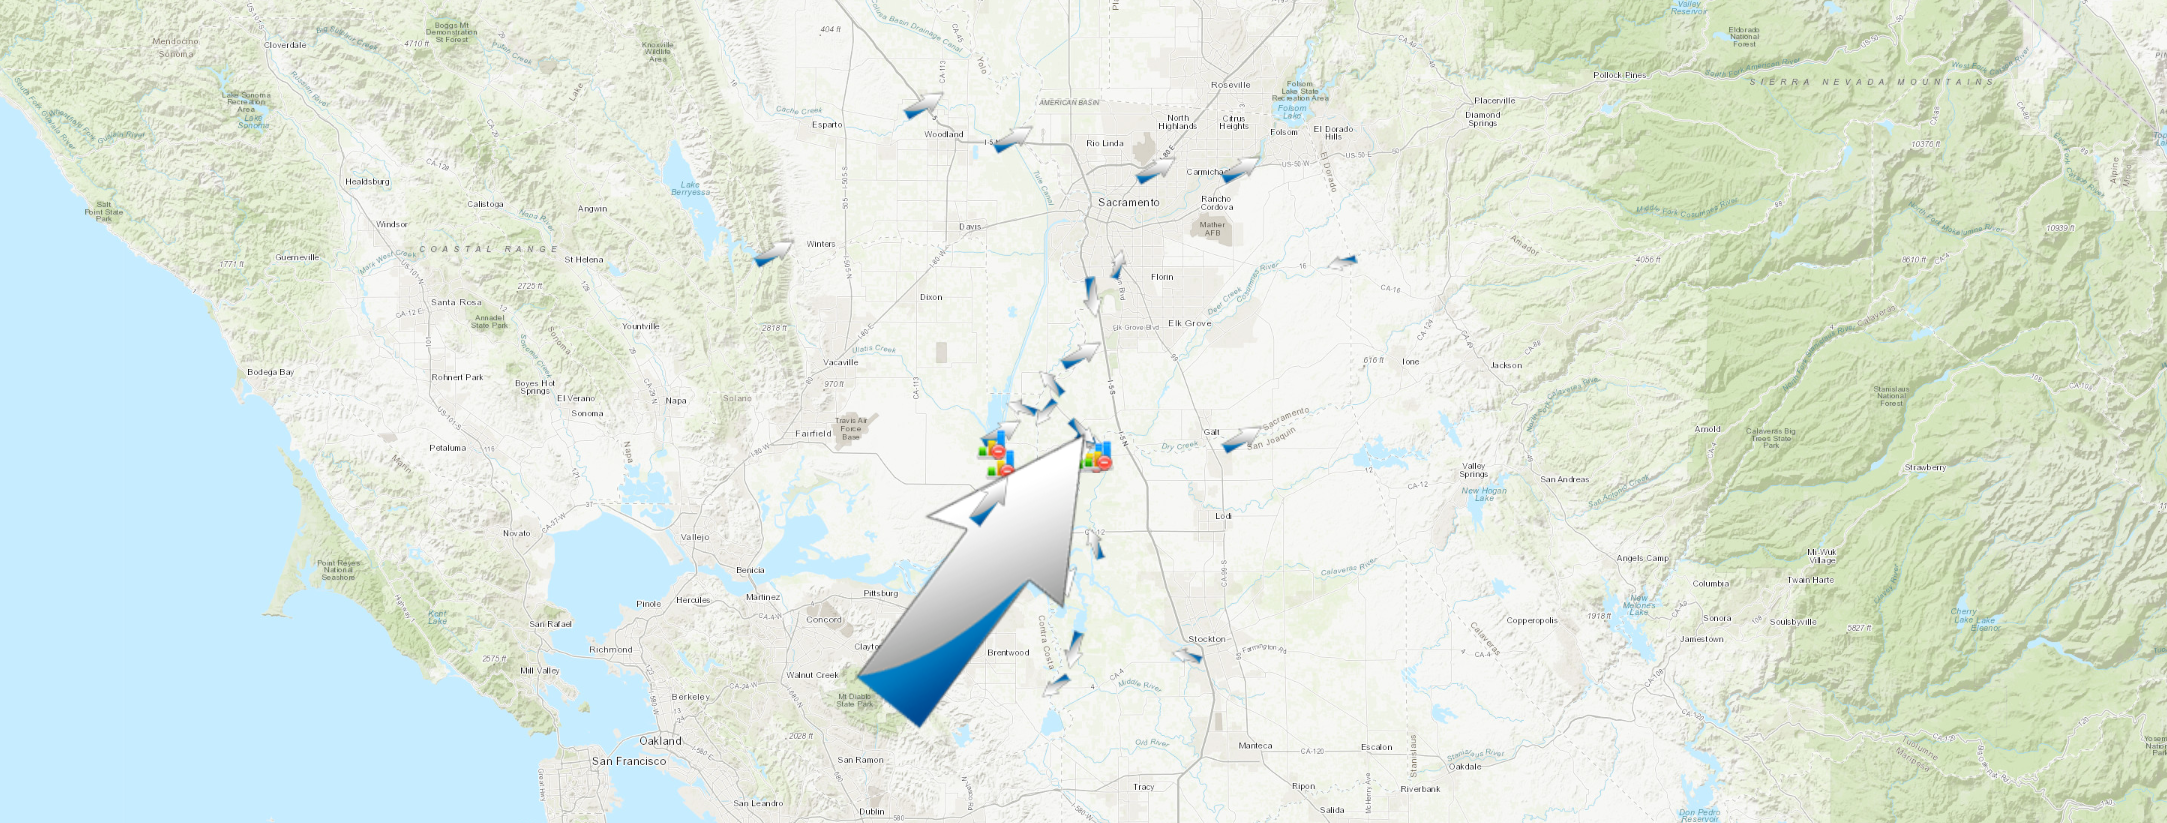
Projects_Mobile.png
2020-03-10 17:25
25K
River_Stage.png
2020-03-10 17:25
27K
River_Stage_in_the_Delta.png
2020-03-10 17:25
26K
Sacramento_River_Forecasts_(NOAA)_Next_7_Days.png
2020-03-10 17:25
25K
Sacramento_River_Water_Temperature_(CDEC)_3_Days.png
2020-03-10 17:25
29K
San_Joaquin_Precipitation_Index_Stations_(Incremental).png
2020-03-10 17:25
32K
Screen_Shot_2018-04-04_at_9.34.43_AM.png
2020-03-10 17:25
6.9K
Screen_Shot_2018-04-06_at_10.41.58_AM.png
2020-03-10 17:25
27K
Screen_Shot_2018-04-25_at_3.51.01_PM.png
2020-03-10 17:25
11K
Screen_Shot_2018-04-30_at_10.33.07_AM.png
2020-03-10 17:25
16K
Snow_Water_Equivalent_(NOAA_National_Operational_Hydrologic_Remote_Sensing_Center_Data).png
2020-03-10 17:25
24K
Southern_California_Snow_Depth_(CDEC)_3_Days.png
2020-03-10 17:25
27K
Southern_California_Snow_Water_Content_Revised_Last_14_Days.png
2020-03-10 17:25
28K
Specific_conductance_(USGS)_3_Days.png
2020-03-10 17:25
27K
Tide_Predictions_(NOAA)__Next_7_Days.png
2020-03-10 17:25
29K
Tulare_Basin_Precipitation_Index_(Incremental).png
2020-03-10 17:25
32K
Turbidity__Detla_-_Key_Stations_#1.png
2020-03-10 17:25
27K
Turbidity__Detla_-_Key_Stations_#1_-_NTU.png
2020-03-10 17:25
27K
Turbidity__Detla_-_Key_Stations_#2.png
2020-03-10 17:25
27K
Turbidity__Detla_-_Key_Stations_FNU.png
2020-03-10 17:25
28K
Turbidity__Detla_-_Key_Stations_NTU.png
2020-03-10 17:25
29K
Turbidity_in_the_Delta.png
2020-03-10 17:25
23K
USGS_CDOM_fluorescence_Last_7_Days.png
2020-03-10 17:25
29K
USGS_Dissolved_Oxygen_%_Saturation.png
2020-03-10 17:25
29K
USGS_Dissolved_Oxygen_BGC_Project.png
2020-03-10 17:25
28K
USGS_Electical_Conductivity_(micro_s)__CDEC_Web_Service.png
2020-03-10 17:25
27K
USGS_Flow_Stations_Delta.png
2020-03-10 17:25
27K
USGS_NO3plusNO2_Water_institu.png
2020-03-10 17:25
29K
USGS_Turbidity_FNU__CDEC_Web_Services.png
2020-03-10 17:25
29K
United_States_Drought_Monitor_Weekly_Update.png
2020-03-10 17:25
21K
Water_Temperature_in_the_Delta.png
2020-03-10 17:25
27K
pH_(USGS)_3_Days.png
2020-03-10 17:25
27K
pH_(USGS)_Delta_3_Days.png
2020-03-10 17:25
27K
pH_Delta_Last_7_Days.png
2020-03-10 17:25
27K
Apache/2.4.52 (Ubuntu) Server at emp.opennrm.org Port 443
_3_Days.png)
__3_Days.png)
_Delta_Last_3_Days.png)
__Delta.png)
_Next_7_Days_Chipps_Island_San_Joaquin_R._at_Venice_Island_Sacramento_R._at_Rio_Vista.png)
_3_Days.png)
_3_Days.png)
_7_Days.png)
_3_Days.png)
_3_Days.png)
_3_Days_BGC_Project.png)
_Delta_3_Days.png)
__Delta.png)
_Select_Delta_Stations.png)
__Delta.png)
__3_Days.png)
__7_Days.png)
_3_Days.png)
_3_Days.png)
__Next_7_Days.png)
_Stations_-_WY_to_Date.png)
__3_Days.png)
.png)
_Next_7_Days.png)
_3_Days.png)
.png)
.png)
_3_Days.png)
_3_Days.png)
__Next_7_Days.png)
.png)
__CDEC_Web_Service.png)
_3_Days.png)
_Delta_3_Days.png)